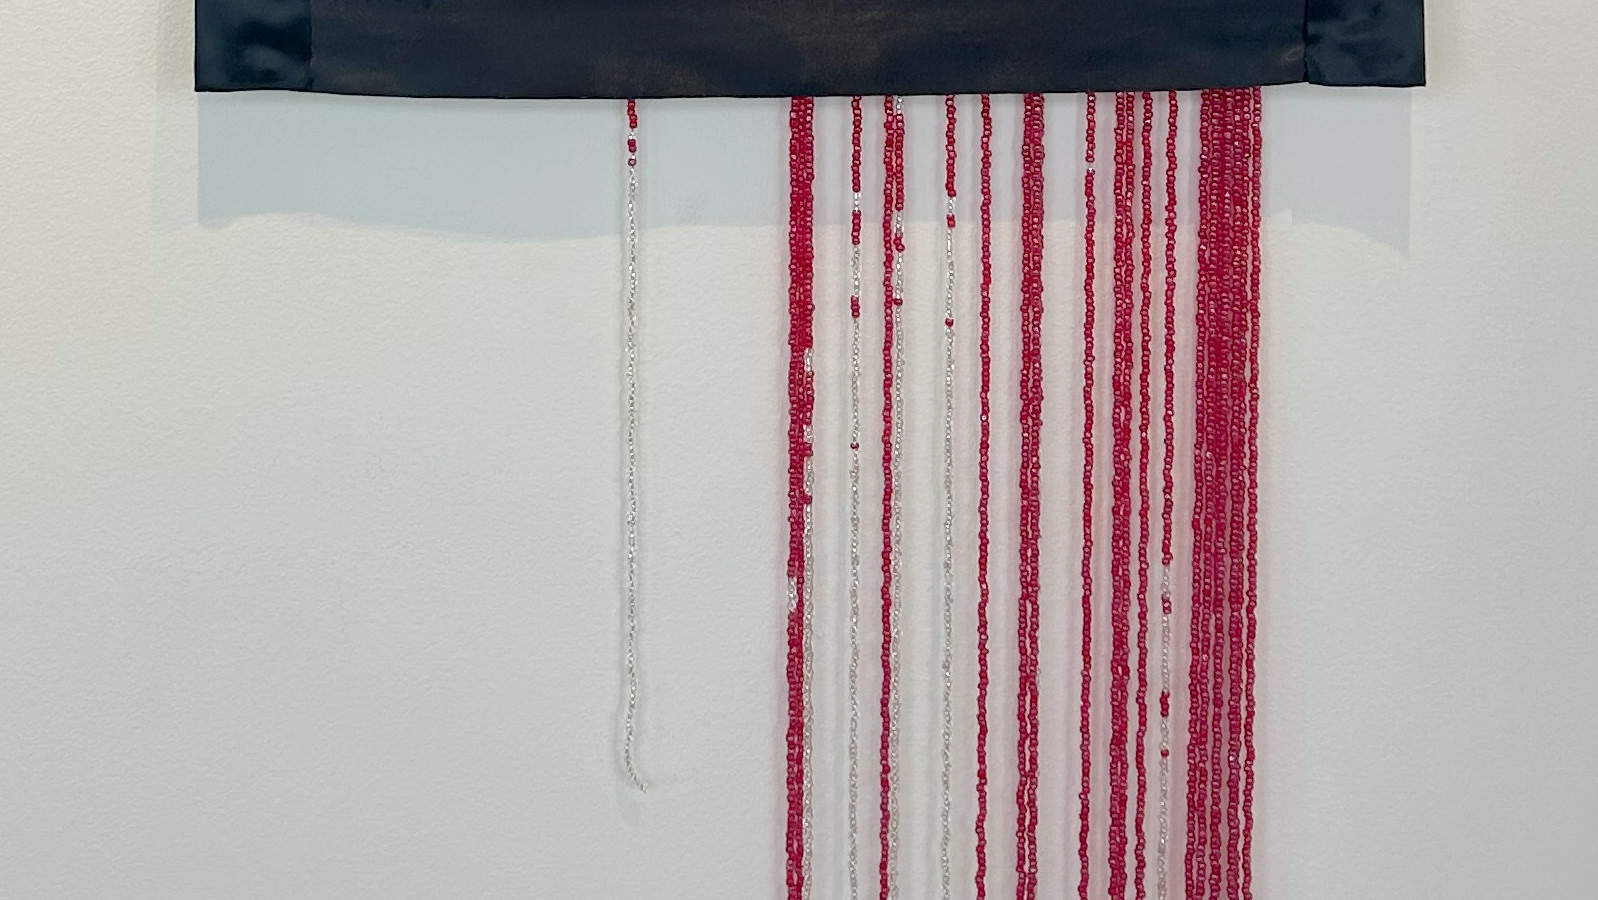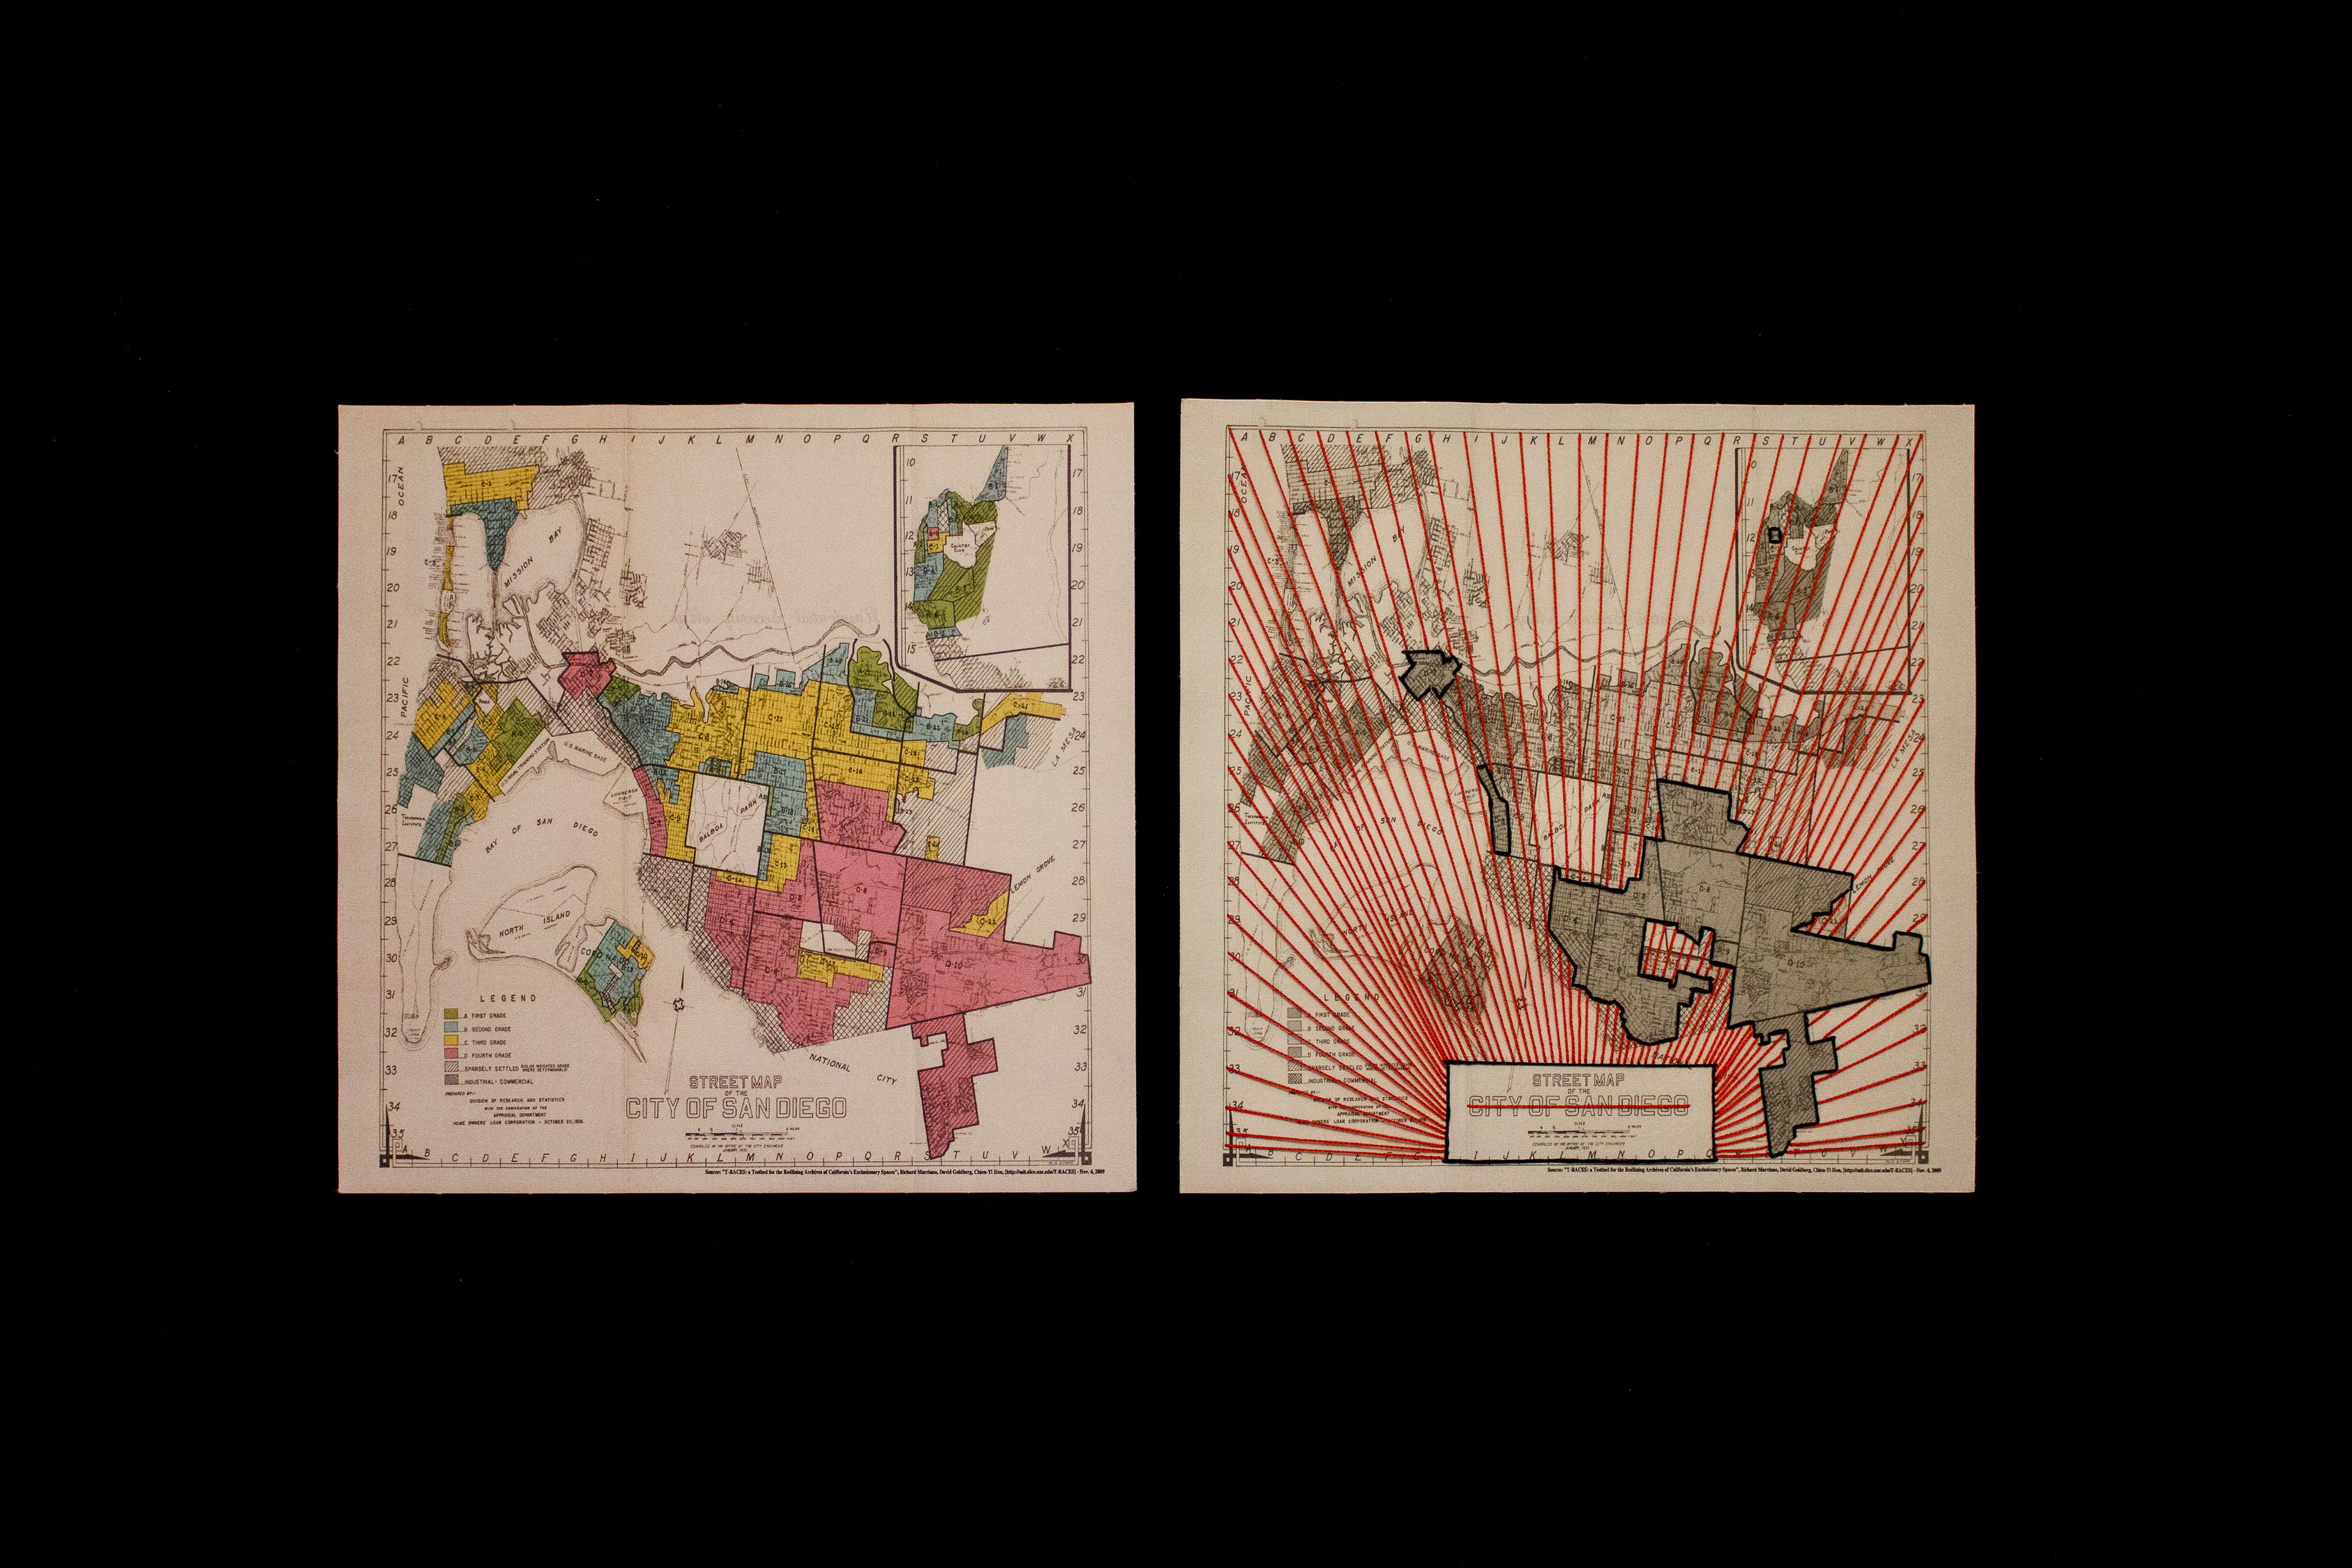
November 2022. Canvas, embroidery floss. 13"x13".
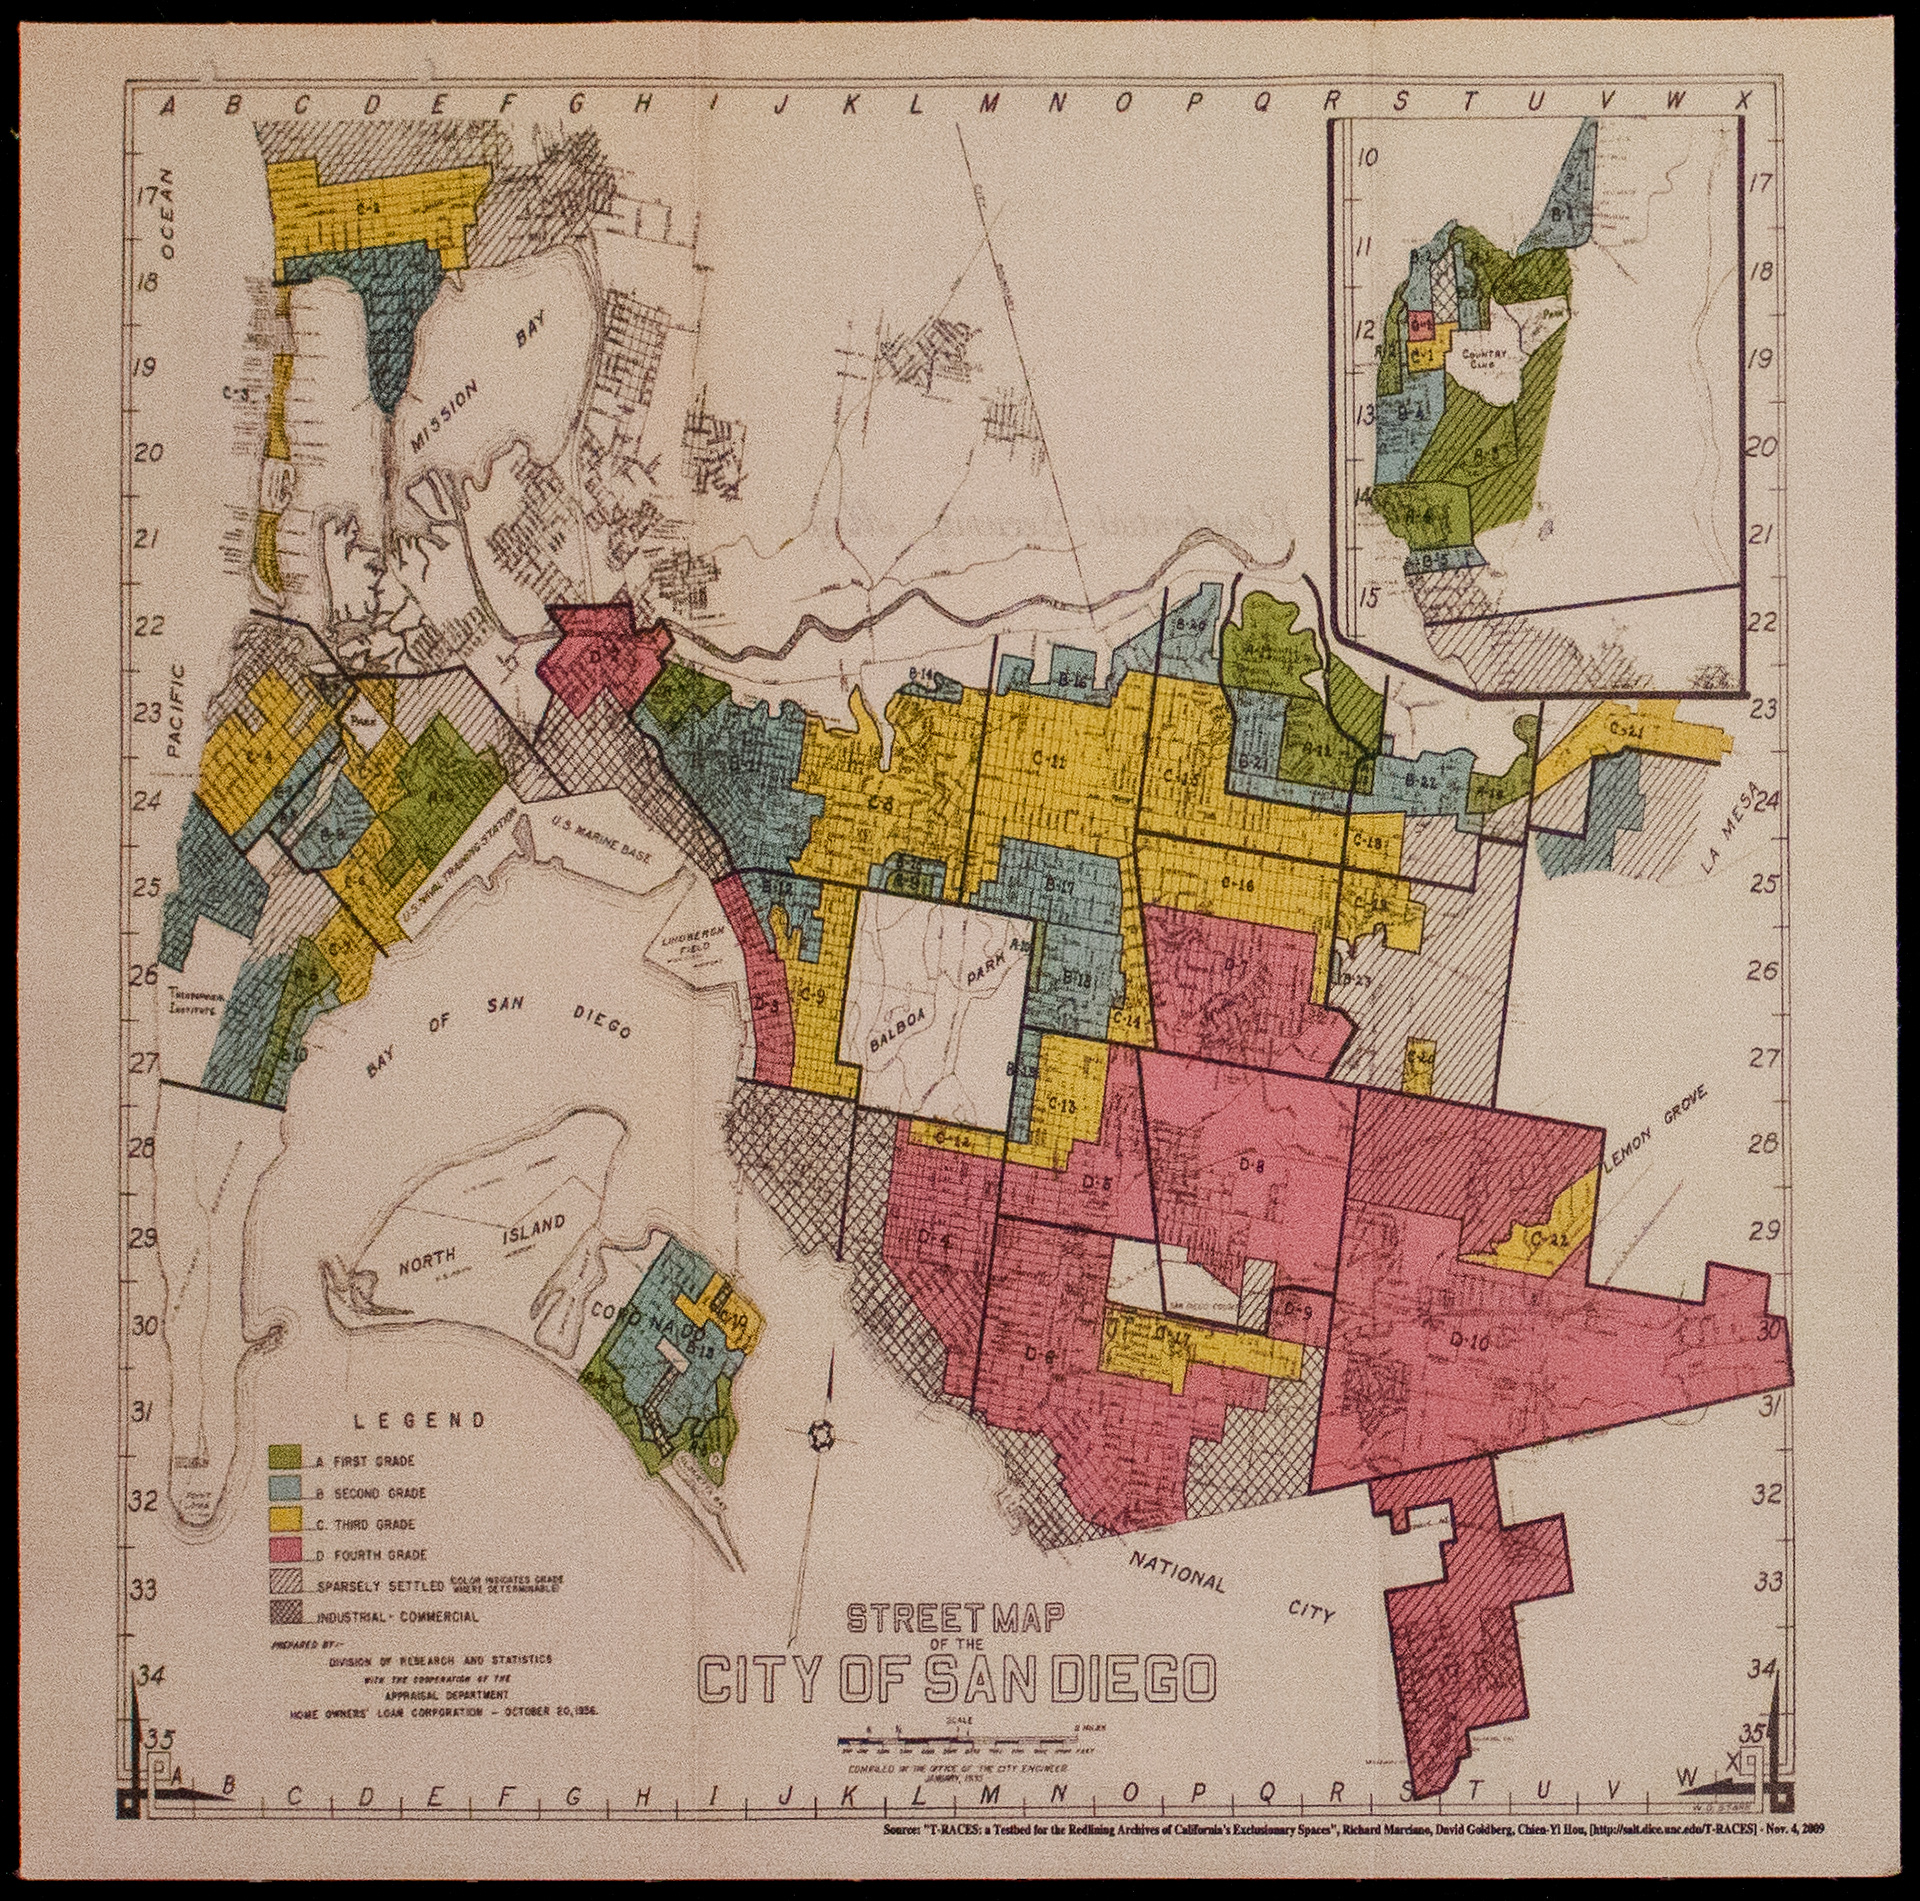
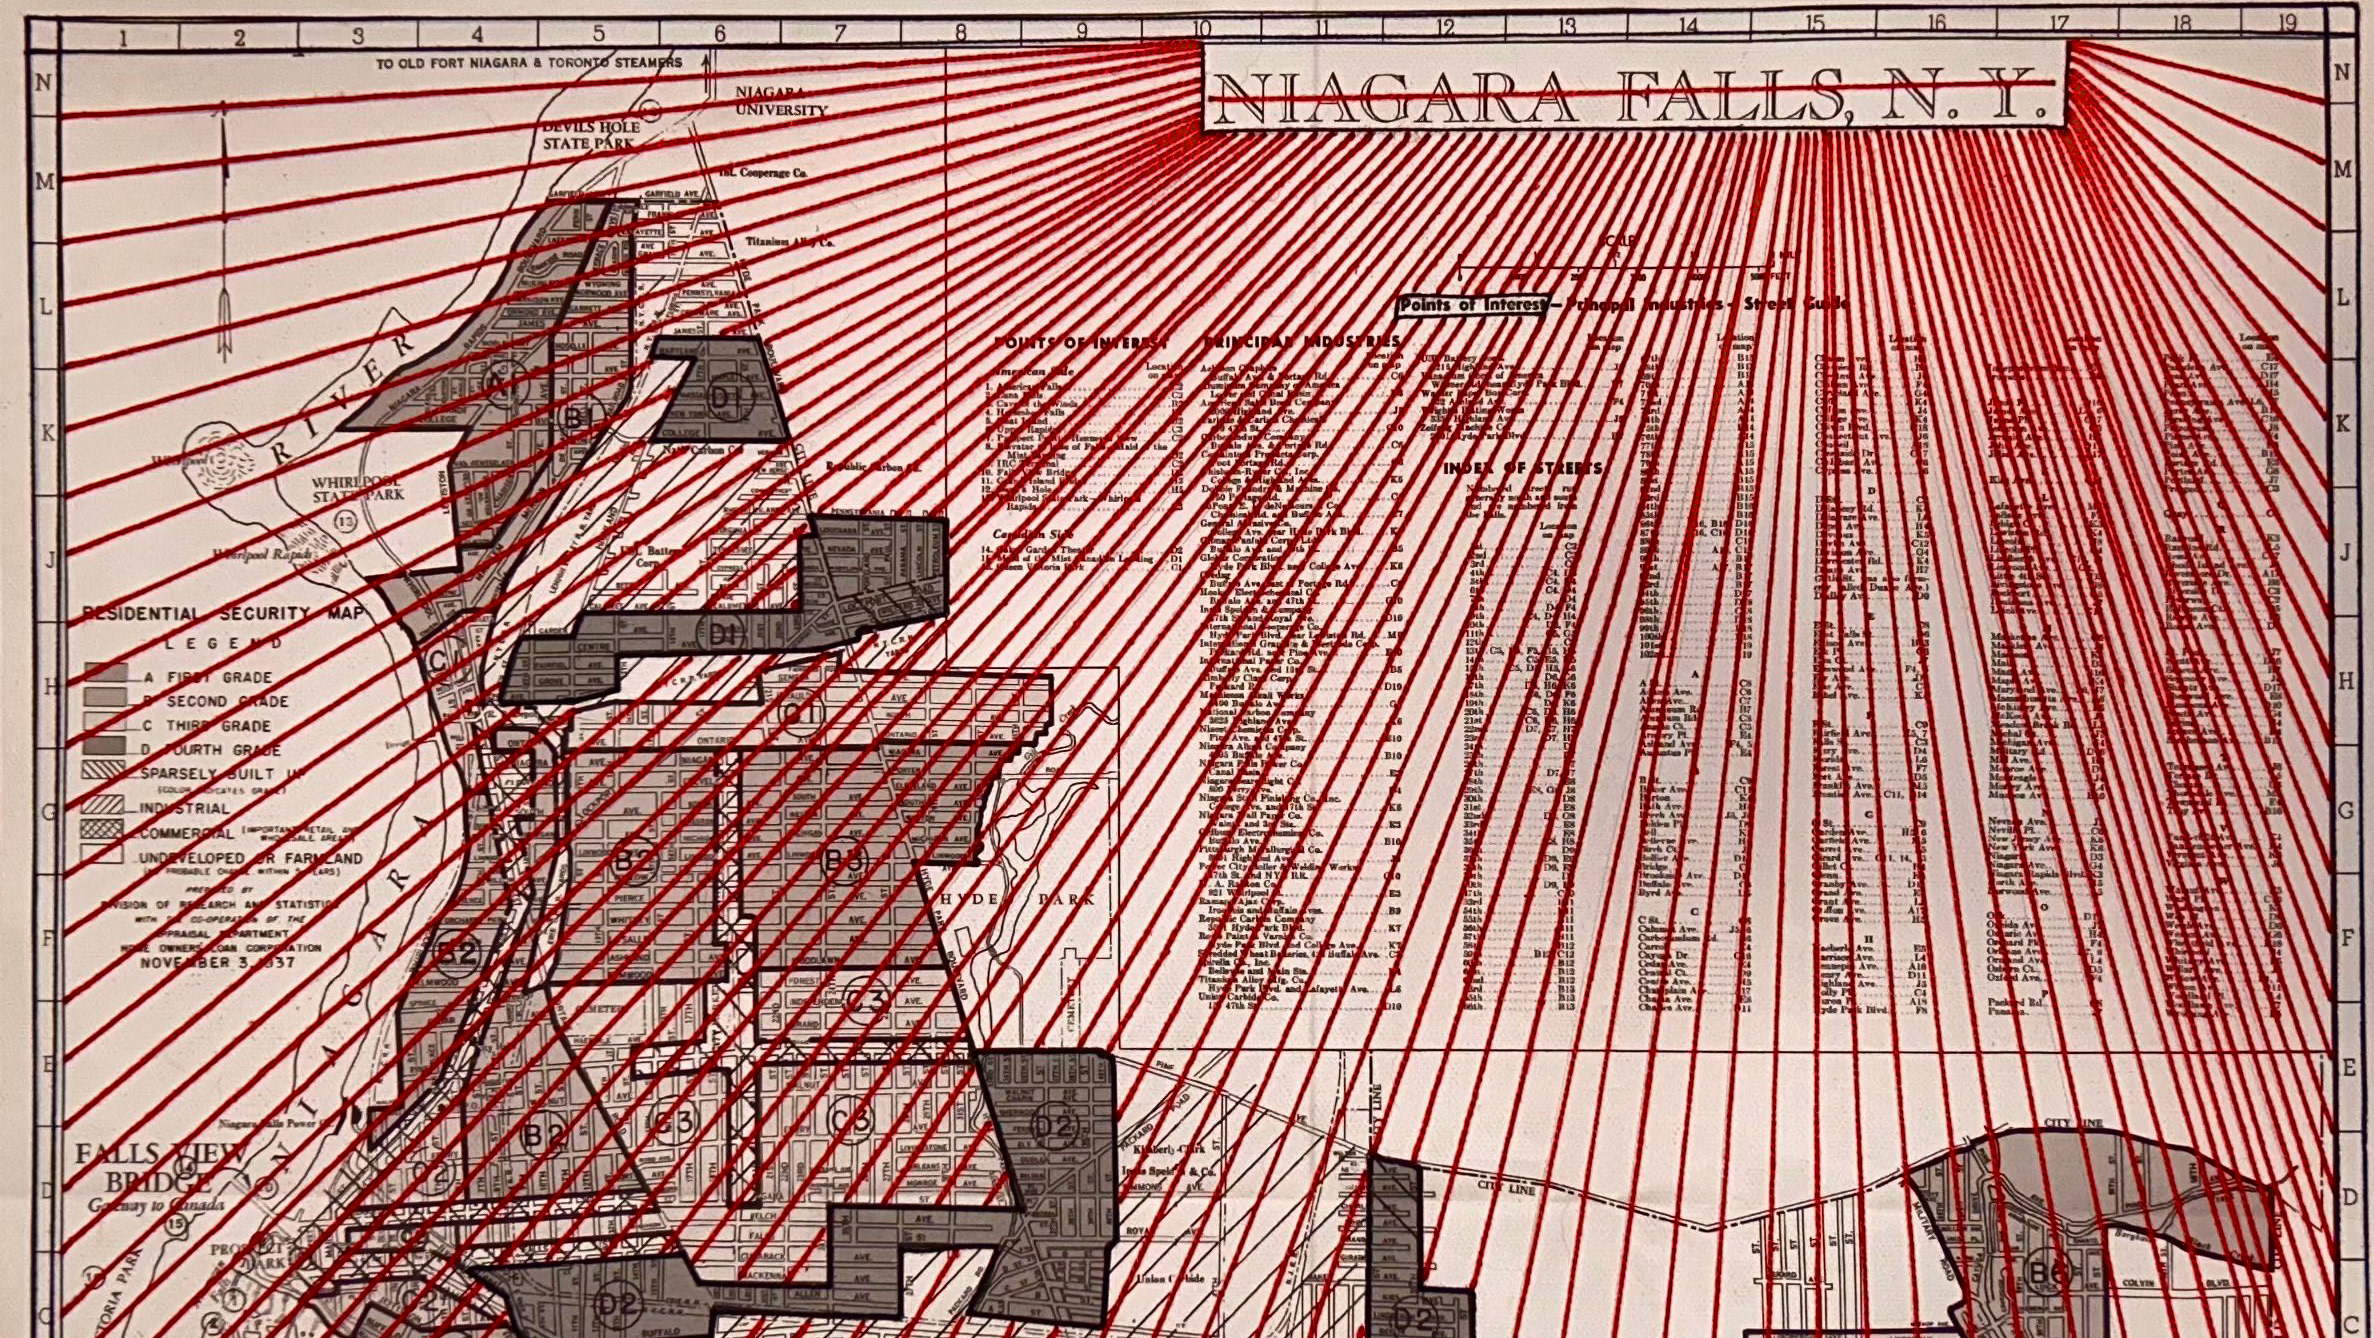
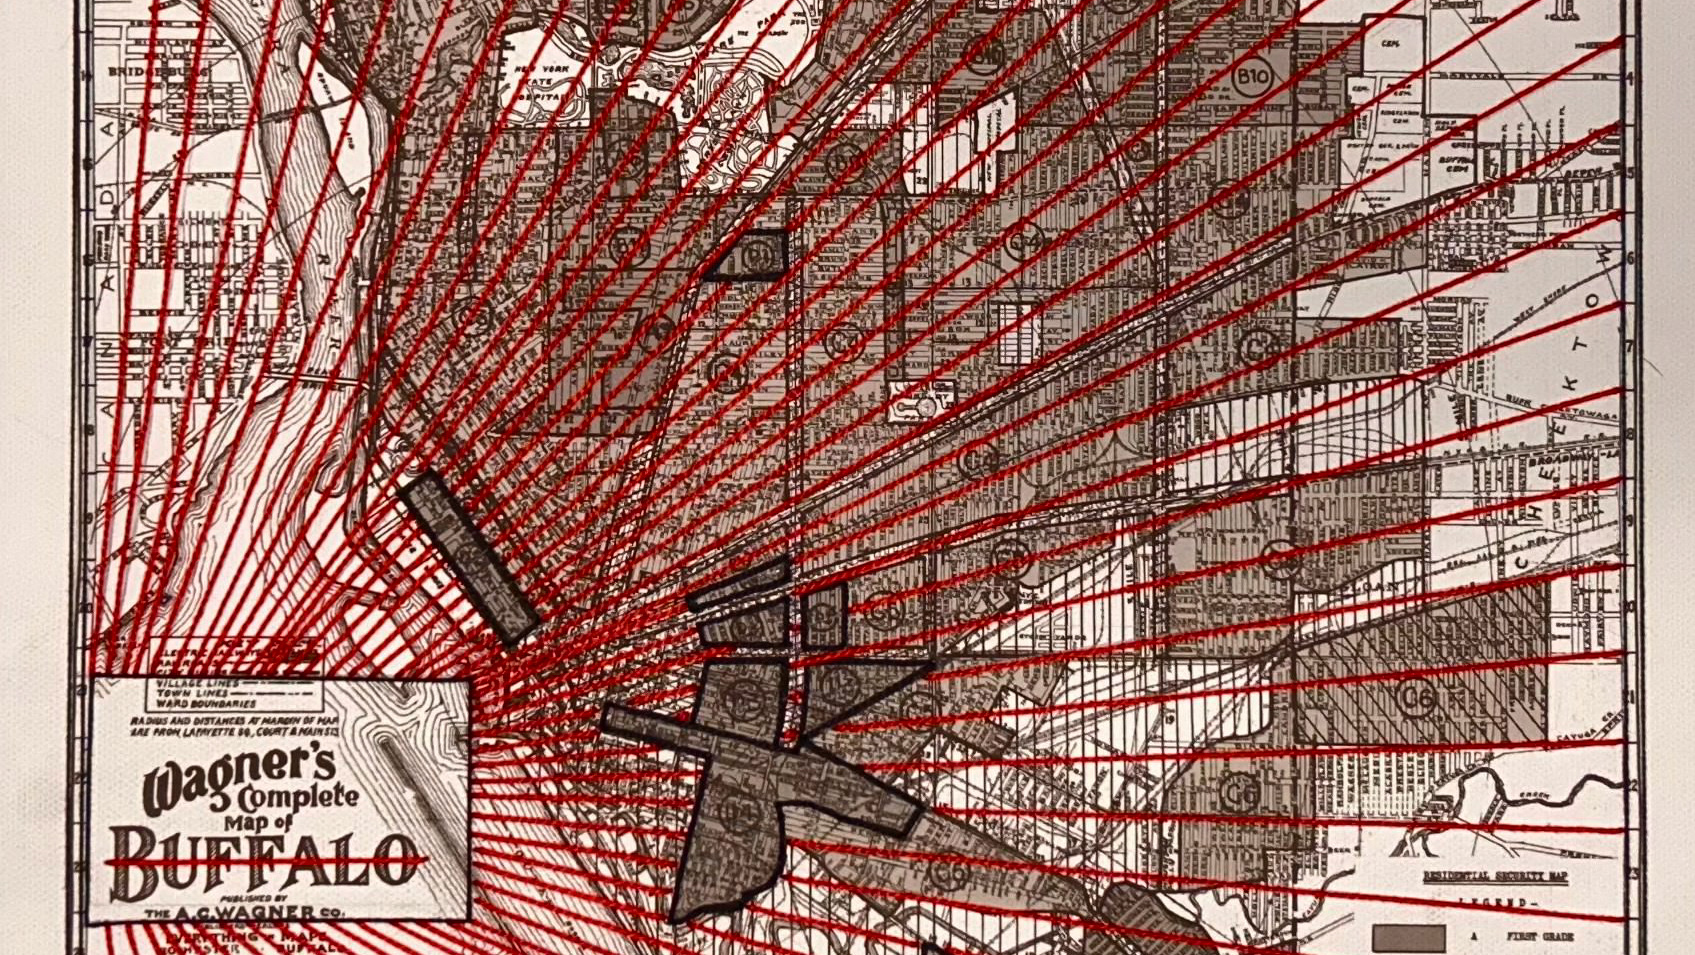
This left "less desirable" neighborhoods facing inequities that continue today. Criteria for the redlining of districts were often based on racial and income discrimination.
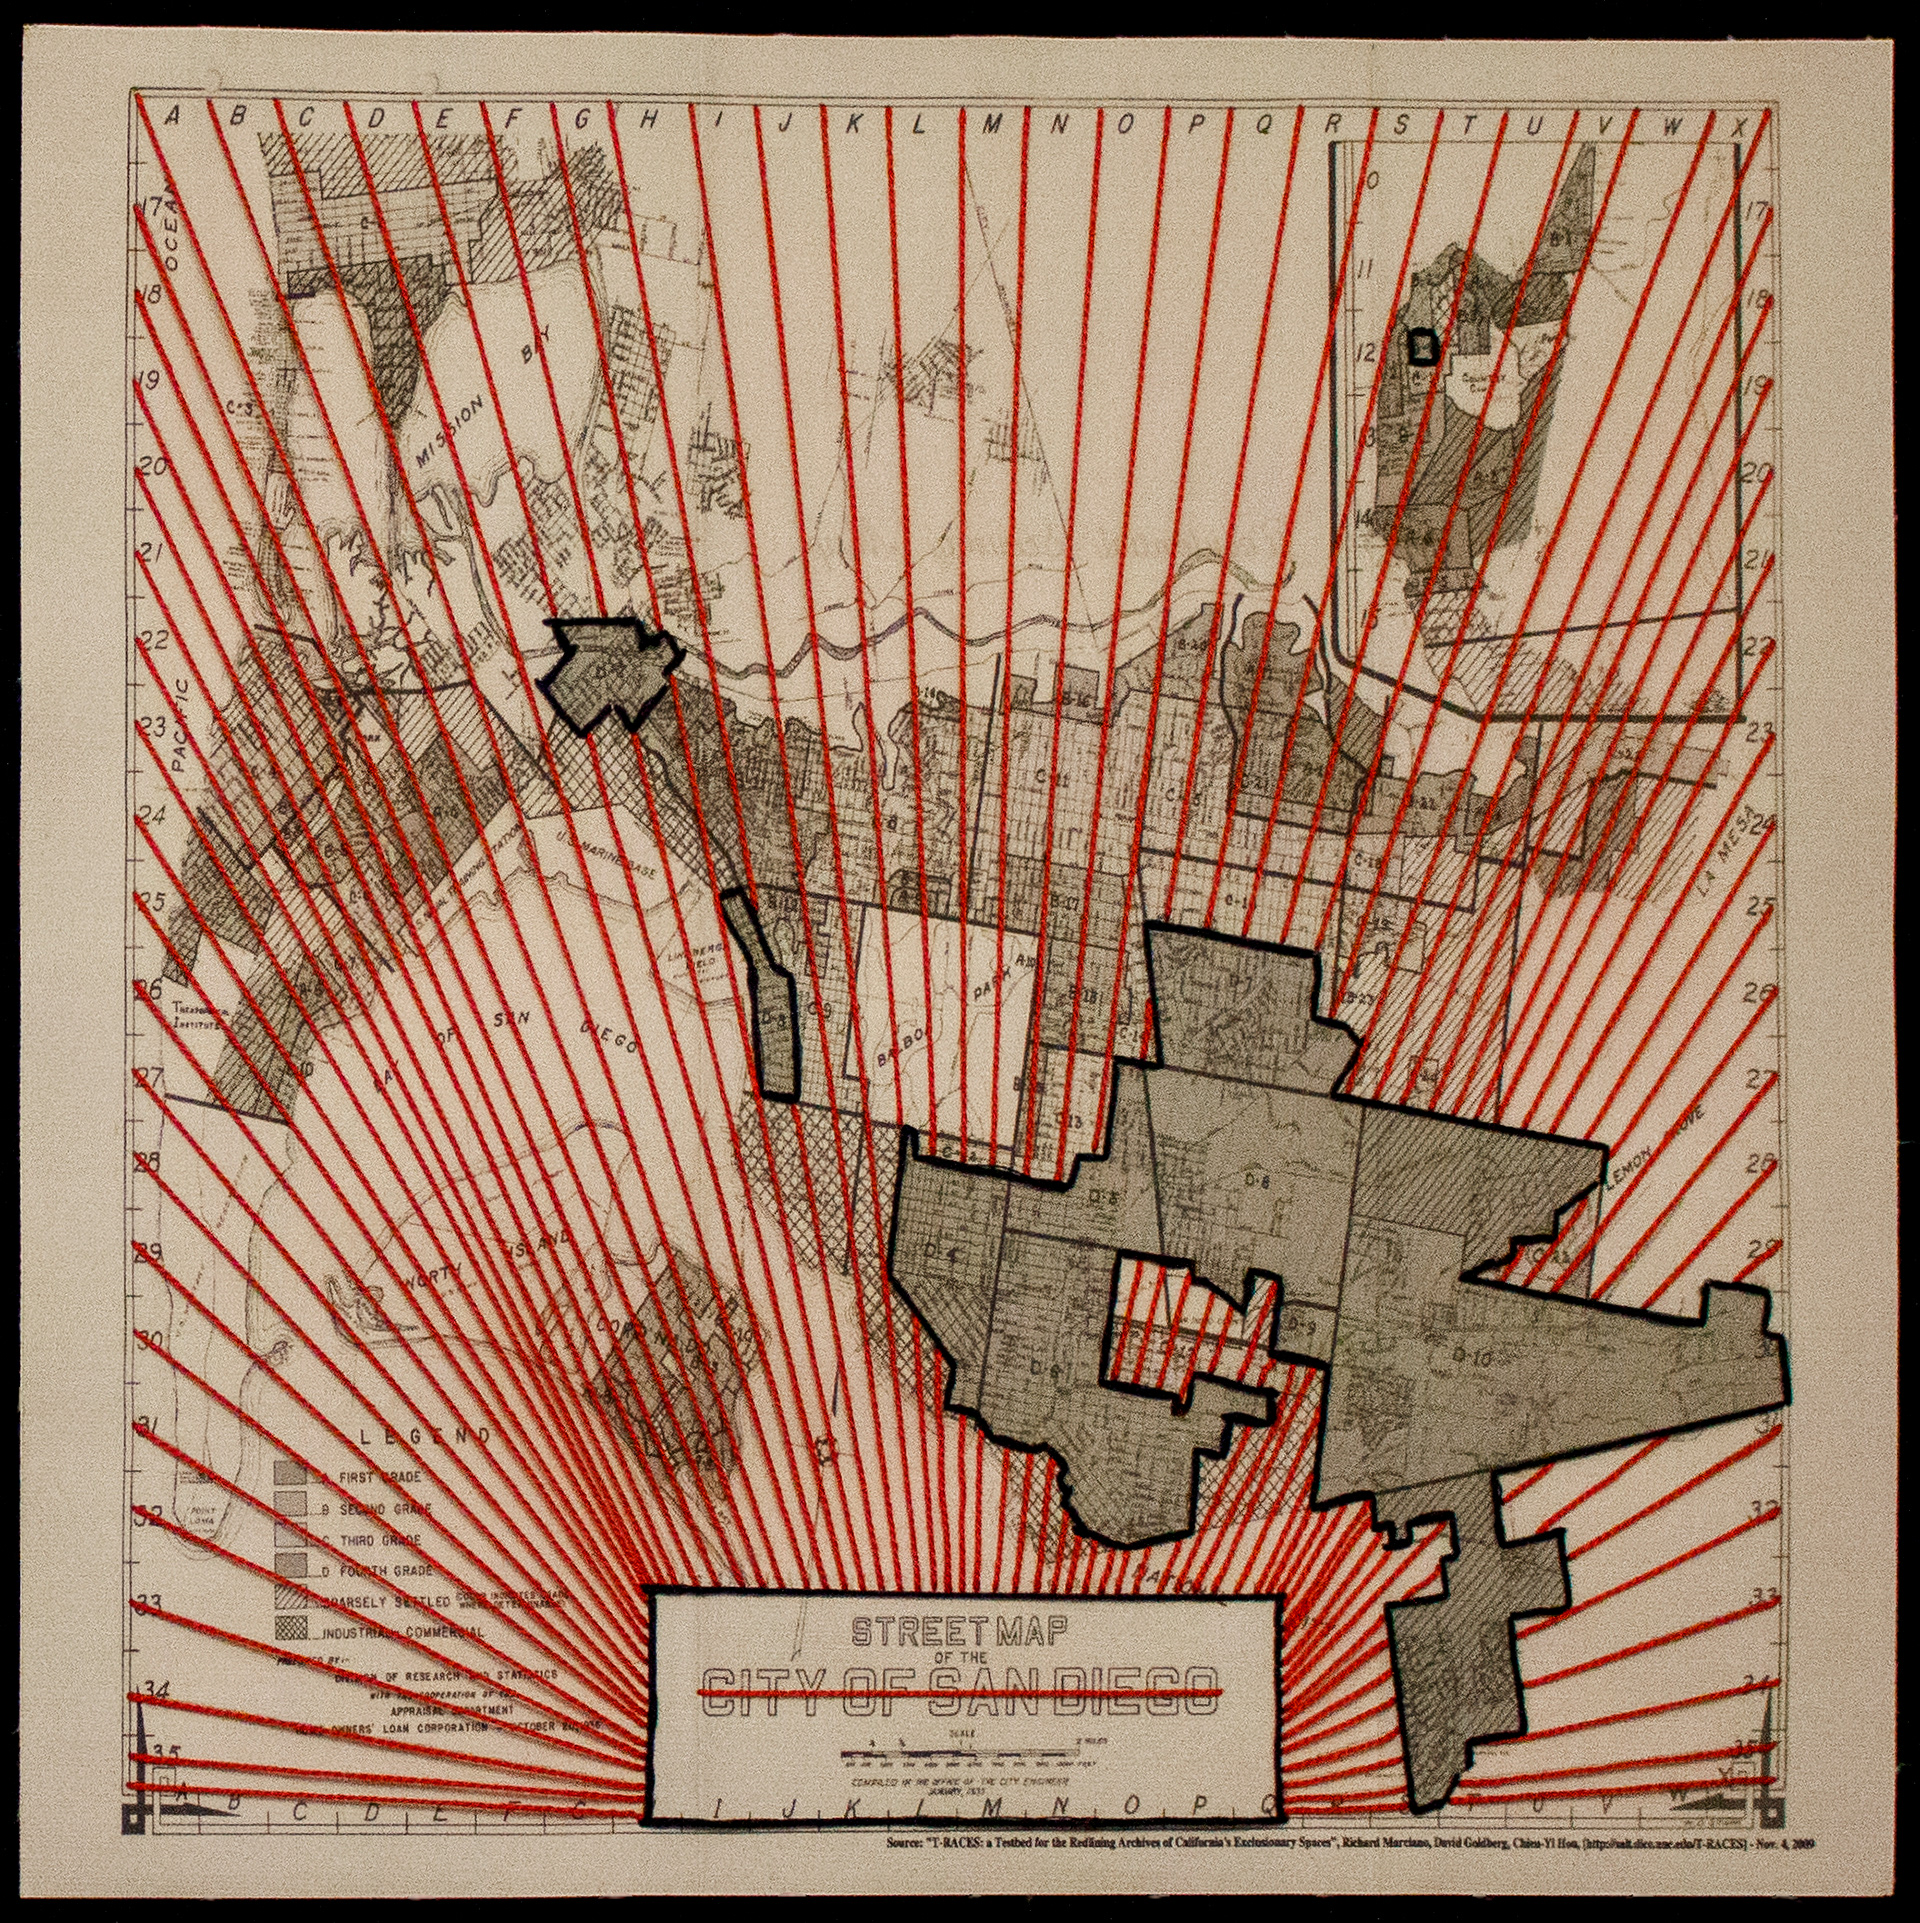
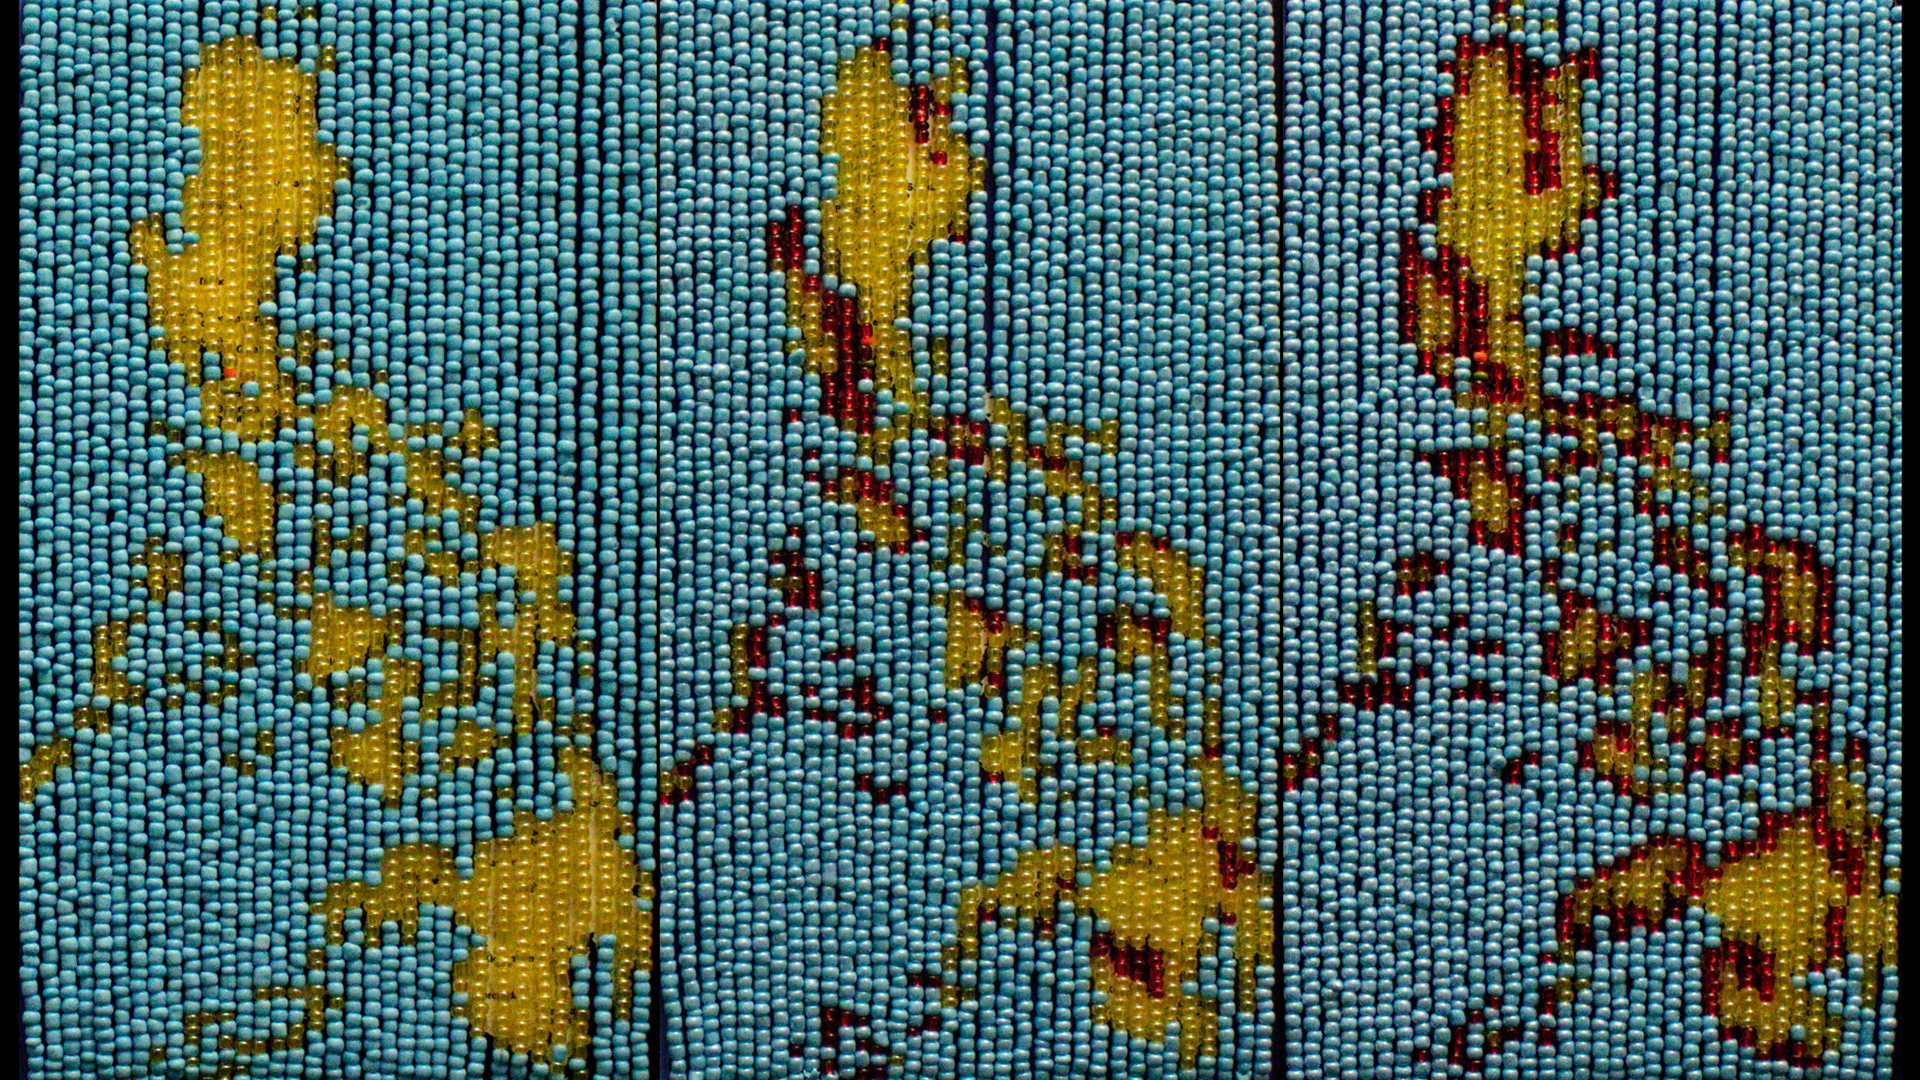
Using the art of threading, I encode information within the design and create an inverse redlined map to show these discriminations, with charts displaying societal and environmental impacts.
Exhibitions:
CSUSM Data Stacks, February 2023
Sources:
Mitchell: https://ncrc.org/wp-content/uploads/dlm_uploads/2018/02/NCRC-Research-HOLC-10.pdf
Hoffman: https://www.mdpi.com/2225-1154/8/1/12/htm